How we create and share value
Economic value generated (1)
| % | 2021 | 2020 | |
|---|---|---|---|
| Gold sales and by-product income (2) | 92 | 4,029 | 4,836 |
| Interest received | 1 | 58 | 30 |
| Royalties received | – | 2 | – |
| Profit from sale of assets | 1 | 22 | 2 |
| Income from investments | 6 | 249 | 261 |
| Other Income | – | – | 5 |
| Total economic value generated | 100 | 4,360 | 5,134 |
- This economic value-added statement includes the South African operations until the date of sale
- Gold sales decreased by 10% due to lower gold production in 2021 compared to 2020.
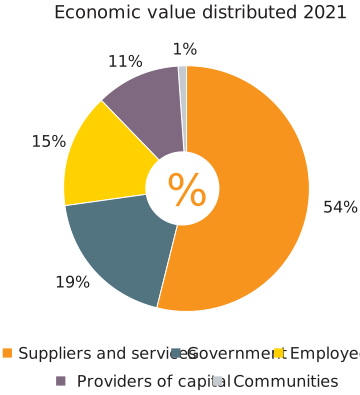


Economic value distributed(1)(7)
| US dollar million | 2021 | 2020 | Contributing to the SDGs | |
|---|---|---|---|---|
 |
Providers of capital | 364 | 221 |   |
| Finance costs and unwinding of obligations | 140 | 183 | ||
| Dividends | 224 | 38 | ||
 |
Employees(2) | 515 | 508 |    |
 |
Government | 656 | 1,055 |   |
| Current tax(3) | 248 | 562 | ||
| Royalties(4) | 149 | 175 | ||
| Employee taxes (4) | 167 | 209 | ||
| Production, property and other taxes(4) | 92 | 109 | ||
 |
Community(5) | 15 | 22 |
|
 |
Suppliers and services(6) | 1,836 | 1,664 | |
| Total economic value distributed | 3,386 | 3,470 |
- Economic distribution providing human, financial, social, natural and manufactured capital, guided by business objectives and key issues identified through the operating process to ensure sustainable long-term value retention for stakeholders, underpinned by our key behavioural programme operational excellence, implemented at every step of the business from exploration through the entire chain to divestment/disposal
- Payments to employees include salaries, wages and other benefits
- Current taxation includes normal taxation and withholding taxation on dividends paid per jurisdiction in which the Group operates
- Employee, production, property and other taxes and royalties are reported on a cash basis and exclude equity-accounted joint ventures
- Community and social investments exclude expenditure by equity-accounted joint ventures
- Suppliers and services excludes capital expenditure
- This economic value-added statement includes the South African operations until the date of sale
Current taxation by region
| (US dollar million) | 2021 | 2020 (1) |
|---|---|---|
| Africa | 147 | 300 |
| Americas | 108 | 186 |
| Australia | (3) | 71 |
| Other | (4) | 50 |
| Total | 248 | 562 |
- Includes the South African operations until the date of sale