2025 – a record year


Gold produced

Free cash flow APM

Adjusted EBITDA APM

Total cash costsAPM

All-in sustaining costsAPM

Dividends declared

Revenue from product sales

Adjusted net (cash) debtAPM to adjusted EBITDAAPM

Total recordable injury frequency rate (TRIFR) per million hours worked*

Note: APM refers to “alternative performance measures”, which are non-IFRS or non-GAAP financial measures. For more information on each of these measures, indicated by APM in the report, and how they are defined and calculated, see Alternative performance measures on pages 237–256 in the full 2025 Annual Report (PDF – 9.65MB)

View from the top


Delivering on our strategy


Record results across key financial metrics, including earnings and free cash flowAPM, reflect our focus on consistent operational improvements, disciplined cost control, and strong execution to ensure gold price increases flow to the bottom line and enhance shareholder returns. Actively strengthening the portfolio remains a strategic priority. With the integration of Centamin, targeted disposals of non-core assets and a high-quality organic pipeline, we are well positioned to drive growth and maintain relative outperformance. Importantly, our strong operational and financial performance coincides with an unwavering commitment to safety, our highest priority. We remain clear that safety leadership is an ongoing journey that means sustainably eliminating serious injuries and fatalities from our business. We adopt a holistic approach in managing the delivery of key performance indicators (KPIs) against our five strategic focus areas.

Our footprint
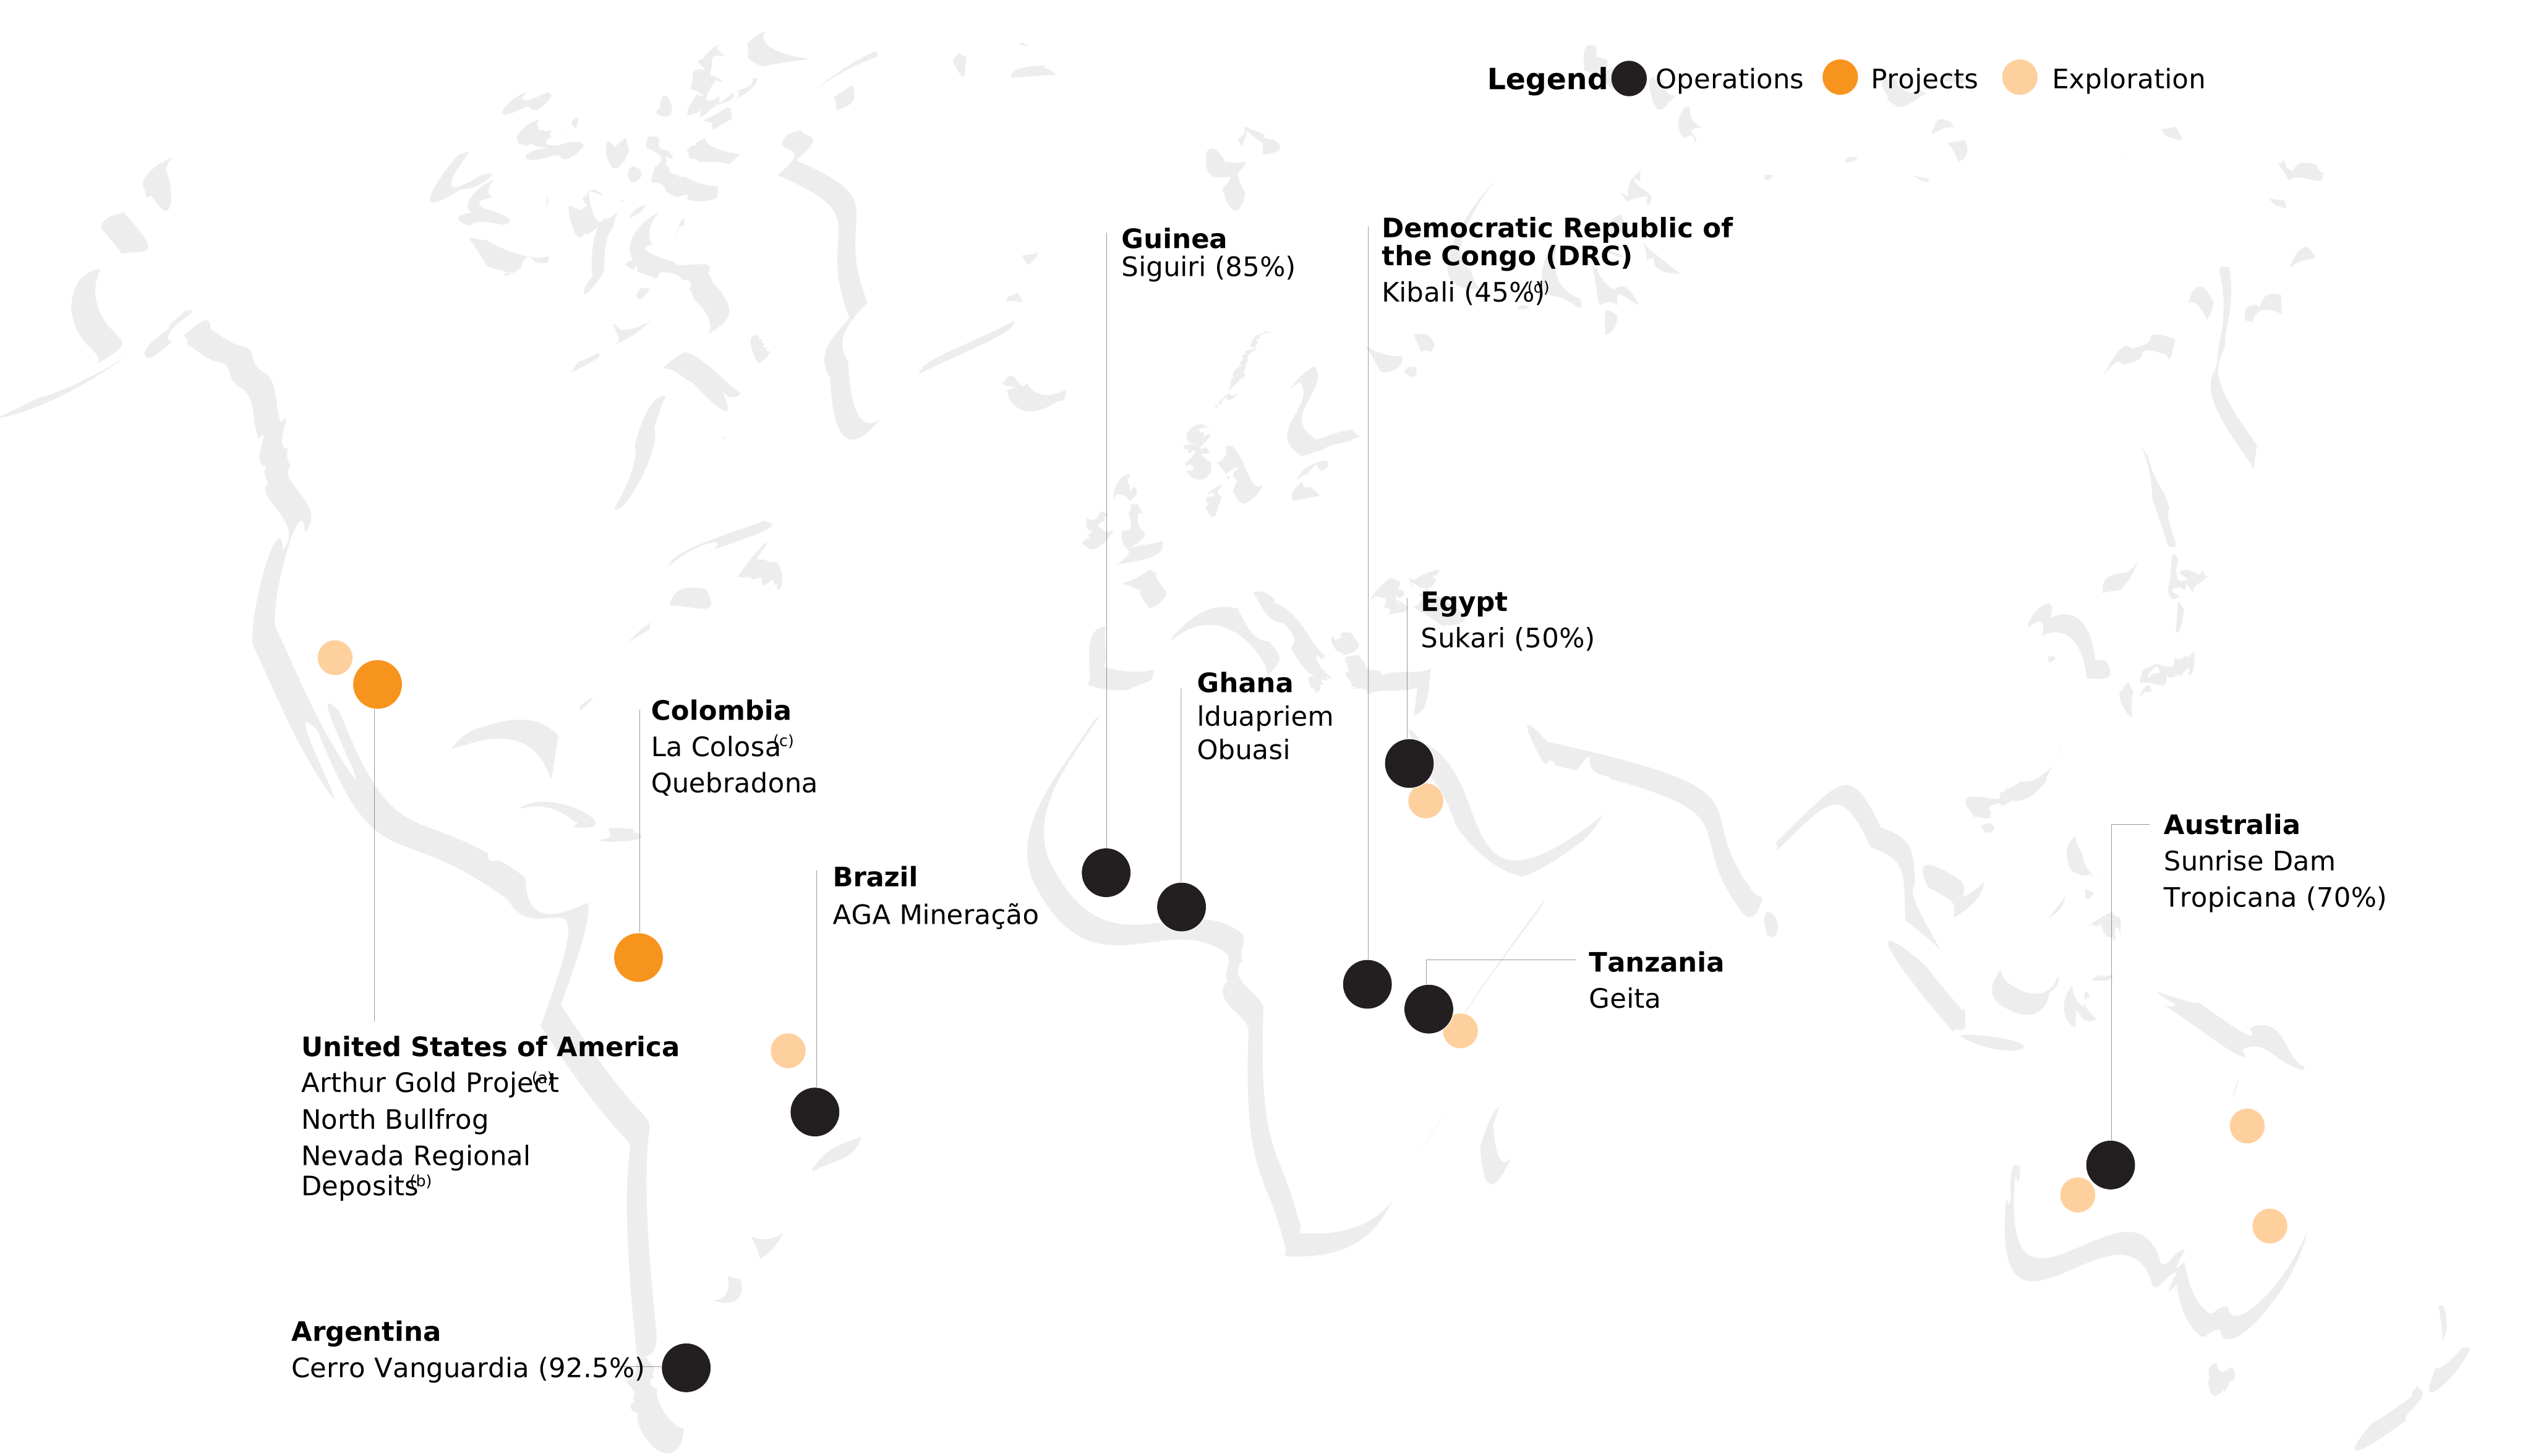

Gold produced

Operating cash flowAPM (2,3,4)

Mineral Reserve (4)

People employed (1,3,4)

Capital expenditure(3,4)

Community investment (3,4)

  1. Previously the Expanded Silicon project, and includes the Silicon and Merlin deposits
  2. Includes the deposits of Reward, Bullfrog, Mother Lode, Crown Block (SNA, Secret Pass and Daisy), and the Sterling mine. Reward and Bullfrog were acquired by AngloGold Ashanti through the acquisition of Augusta Gold Corp. (Augusta Gold) in October 2025
  3. Held for sale. On 7 March 2026, AngloGold Ashanti entered into a definitive agreement to sell AngloGold Ashanti Colombia S.A.S., which owns the La Colosa project, to Mineros S.A.
  4. Operated by Barrick Mining Corporation (Barrick)
  1. Average employed at managed operations which includes contractors
  2. Net cash flow from operating activities plus repayment of loans advanced to joint ventures less distributions paid to non-controlling interests
  3. Includes corporate and non-gold producing subsidiaries
  4. Includes projects

Financial review


CFO’s report

2025 marked a step-change in AngloGold Ashanti’s financial performance and resilience. We did exactly what we set out to do; convert a stronger gold price into free cash flowAPM, maintain operating discipline, invest to sustain and grow the portfolio, and return meaningful capital to shareholders. The outcome was record cash generation, record earnings leverage, and the strongest balance sheet position in our history.

20252024
ARevenue9,8935,793
Bullion sales9,6105,359
Concentrate sales120314
By-product revenue163120

BCost of sales5,0223,726
Of which:
Operating costs3,2312,665
Royalties424246
Amortisation1,287752
CExpenses595395
Of which:
Corporate administration, marketing and related expense(138)(118)
Net impairment (reversal of impairment) and net loss on disposal and derecognition of assets88(58)
Exploration and evaluation267252
Other expenses248144
Associates and JV profit(255)(155)
DTaxation1,102623
Current tax1,031462
Deferred tax71161
Profit for the period3,1741,049
Of which:
Basic earnings per share (US cents)519233
Headline earnings per share (US cents)537221
Of which equity shareholders received ($m)2,6361,004

2025*2024
ETotal assets15,07813,230
Of which:
Tangible assets8,5158,512
Inventories1,2511,213
Cash and cash equivalents2,9051,425

FTotal liabilities5,1624,717
Of which:
Borrowings2,0441,984
Trade and other payables1,015963
Environmental rehabilitation provisions729700
GTotal equity9,9168,513
Total return to shareholders275 %25 %
Total dividends per share (US cents)357c91c

* Restated. See Note 1.4 of the audited annual financial statements included elsewhere in this annual report

Corporate transactions

On 23 October 2025, AngloGold Ashanti acquired all issued and outstanding shares of Augusta Gold at a cash price of C$1.70 per share of common stock. The total cash consideration of $158m included the provision of funds of $39m for the settlement of certain shareholder loans and transaction costs of $14m.

On 1 May 2025, AngloGold Ashanti completed the sale of its entire interest in the Doropo and Archean-Birimian Contact (ABC) projects in Côte d’Ivoire to Resolute Mining Limited for a total consideration of $162m, with $25m received as a cash payment, $103m as deferred consideration and $34m as contingent consideration, resulting in a loss on disposal of $47m.

On 1 December 2025, AngloGold Ashanti completed the sale of Serra Grande to Aura Minerals Inc. (Aura) for a total consideration of $117m, with $73m received as a cash payment and $44m as contingent consideration.

Cash flow from/used in:20252024
HOperating activities4,7841,968
Of which:
Profit before taxation4,2761,672
Amortisation of tangible and right of use assets1,286751
Movements in working capital
   Increase in inventories(57)(78)
   Increase in trade, other receivables and other assets(219)(182)
   Increase in trade and other payables1026
(174)(254)
Net taxation paid(747)(183)
IInvesting activities 1,180 762
Of which:
Capital expenditure on tangible and intangible assets 1,449 1,090
Acquisition of assets 158
Proceeds on disposal of subsidiary, net of cash disposed (77)
Proceeds from disposal of other investments (70)
Acquisition of subsidiary, net of cash acquired (68)
Repayment of loans advanced to JVs (161) (149)
Other investments and assets acquired 3 30
JFinancing activities2,104727
Of which:
Dividends paid to external shareholders and distributions to noncontrolling interests1,871244
Repayment of borrowings245909
Interest on borrowings164126
Proceeds from borrowings(285)(655)
Net cash movement1,500479
Translation(15)(37)
Cash balance at the beginning of the year1,397955
Cash balance at the end of the year*2,8821,397

* Comprises cash and cash equivalents of $2.905m (2024: $1,425m) less bank overdraft of $23m (2024: $28m).

2026 2027
Gold production (koz) Total gold production 2,800 – 3,170 2,850 – 3,220
Managed operations 2,530 – 2,860  
Non-managed joint ventures 270 – 310  
Africa 1,890 – 2,150  
Australia 495 – 555  
Americas 415 – 465  
Costs(1) ($/oz) All-in sustaining costsAPM 1,780 – 1,990 1,780 – 1,990
Managed operations 1,825 – 2,050  
Non-managed joint ventures 1,355 – 1,460  
Africa 1780  
Australia 2100  
Americas 1725  
Total cash costs APM 1,315 – 1,430 1,315 – 1,430
Managed operations 1,335 – 1,455  
Non-managed joint ventures 1,135 – 1,225  
Africa 1300  
Australia 1815  
Americas 1190  
Capital expenditure (1) ($m) Total capital expenditure 1,825 – 1,975 2,000 – 2,200
Managed operations 1,640 – 1,770  
Non-managed joint ventures 185 – 205  
Sustaining capital expenditureAPM 1,040 – 1,140 1,040 – 1,140
Managed operations 985 – 1,075  
Non-managed joint ventures 55 – 65  
Non-sustaining capital expenditureAPM 785 – 835 960 – 1,060
Managed operations 655 – 695  
Non-managed joint ventures 130 – 140  
  1. The Company is not providing quantitative reconciliations to the most directly comparable IFRS measures for its Non-GAAP financial guidance shown above in reliance on the exception provided by Rule 100(a)(2) of Regulation G because the reconciliations cannot be performed without unreasonable efforts, as such, IFRS measures cannot be reliably estimated due to their dependence on future uncertainties and adjusting items, including, among other factors, changes in economic, social, political and market conditions, including related to inflation or international conflicts, the success of business and operating initiatives, changes in the regulatory environment and other government actions, including environmental approvals, fluctuations in gold prices and exchange rates, the outcome of pending or future litigation proceedings, any supply chain disruptions, any public health crises, pandemics or epidemics, and other business and operational risks and challenges and other factors, including mining accidents, that the Company cannot reasonably predict at this time but which may be material.

    Outlook economic assumptions for 2026 and 2027 guidance are as follows: $0.68/A$, BRL5.47/$, AP1,606/$, ZAR16.90/$, Brent $61/bbl and a gold price of approximately $4,250/oz.

    Cost and capital forecast ranges for 2026 are expressed in “nominal” terms. “Nominal” cash flows are current price term cash flows that have been inflated into future value, using an appropriate inflation rate. Costs and capital forecast ranges for 2027 are expressed in “real” terms. “Real” cash flows are adjusted for “inflation” in order to reflect the change in value of money over time. Estimates assume neither operational or labour interruptions or power disruptions, nor further changes to asset portfolio and/or operating mines and have not been reviewed by AngloGold Ashanti’s external auditors. Other unknown or unpredictable factors, or factors outside the Company’s control, including inflationary pressures on its cost base, could also have material adverse effects on AngloGold Ashanti’s future results and no assurance can be given that any expectations expressed by AngloGold Ashanti will prove to have been correct. Measures taken at AngloGold Ashanti’s operations together with AngloGold Ashanti’s business continuity plans aim to enable its operations to deliver in line with its production targets. Actual results could differ from guidance and any deviations may be significant. Please refer to the Risk Factors section in AngloGold Ashanti’s Annual Report on Form 20-F for the financial year ended 31 December 2025 filed with the SEC.

Note: Our financial results are prepared in accordance with IFRS, see page 161 of the full 2025 Annual Report for further information. The detailed reconciliations of our APMs are set out on pages 237–256.
Regional review: Africa

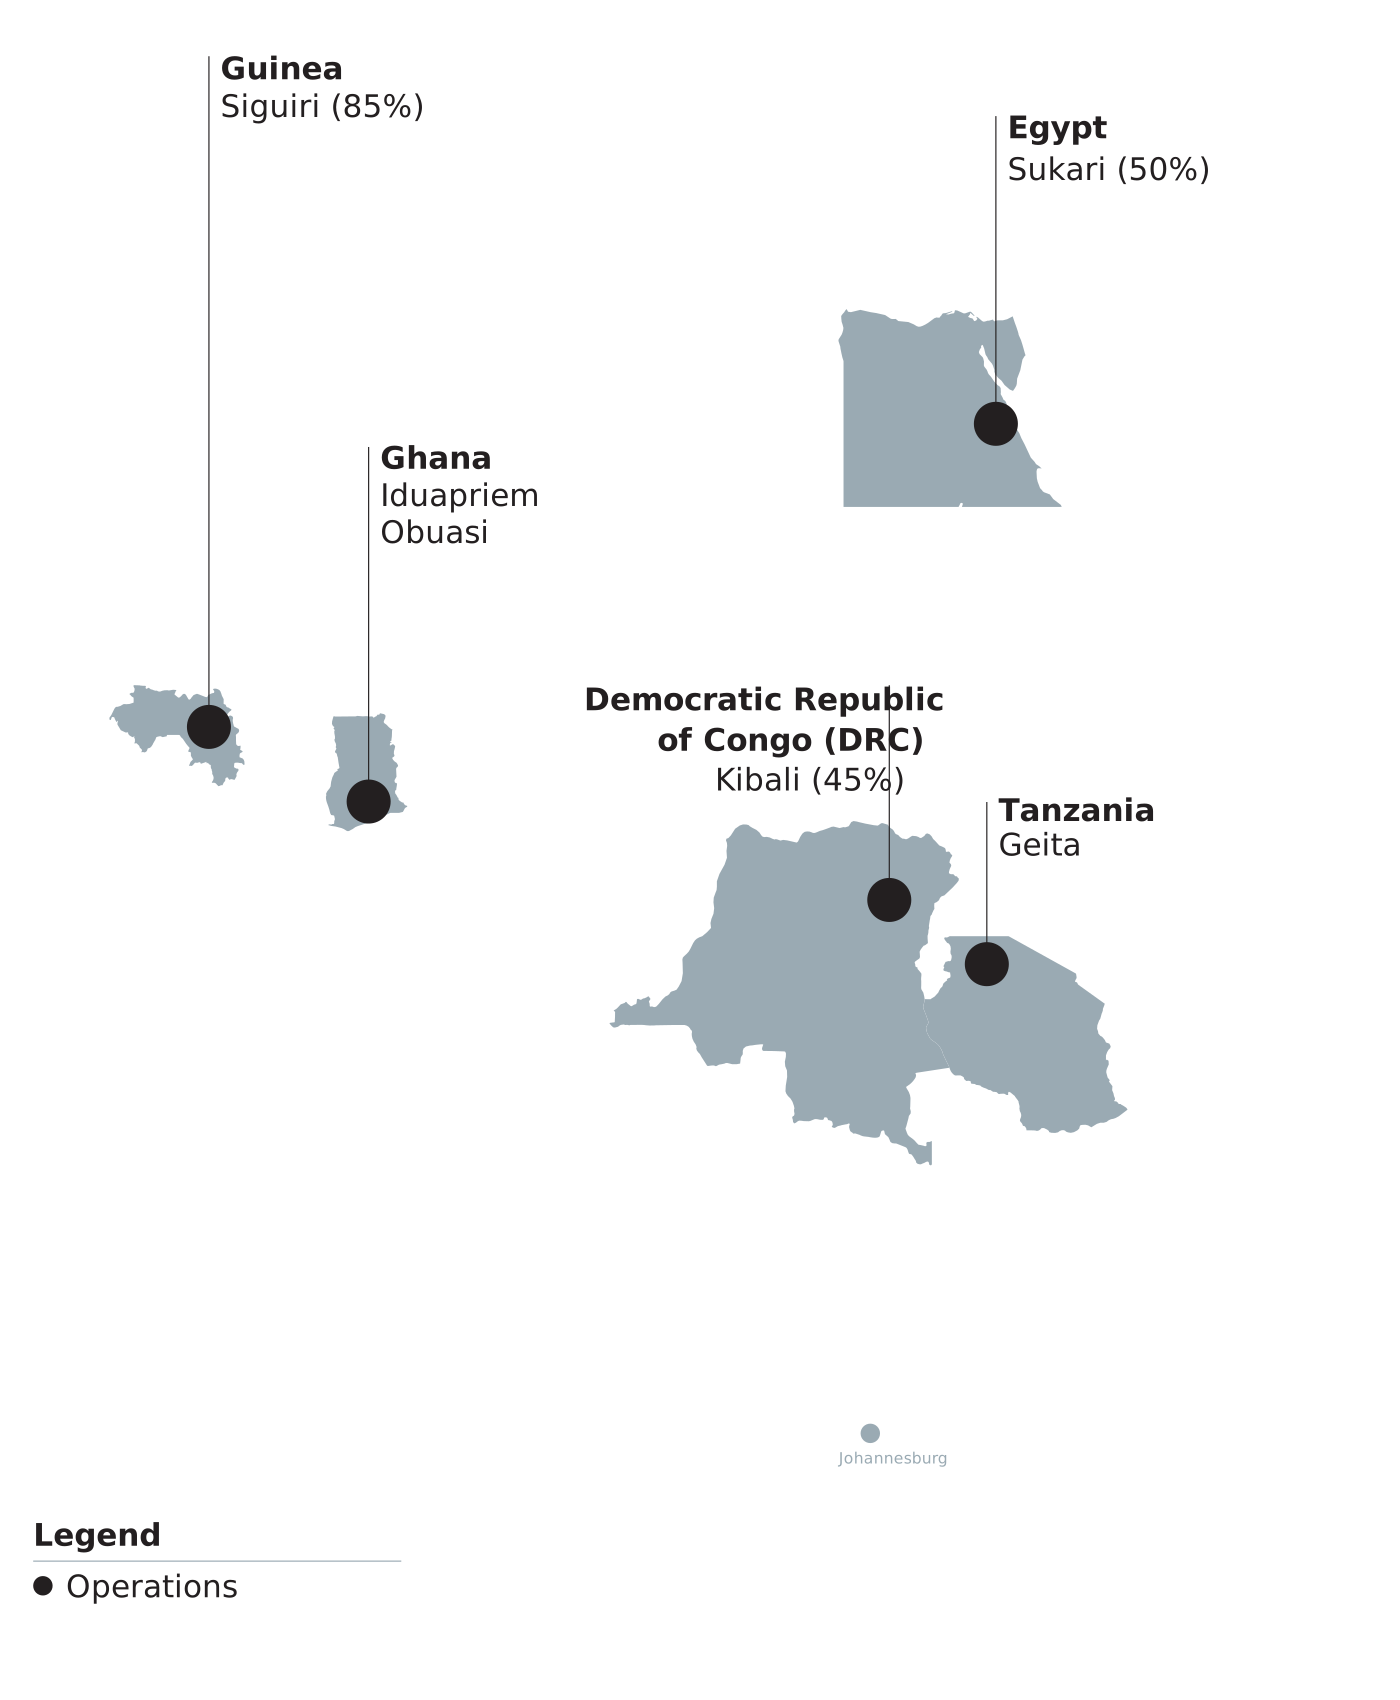
Africa is home to six of our operations. Our managed operations are in Egypt, Ghana, Guinea and Tanzania. In the DRC, Kibali is managed by Barrick, our joint venture partner.

At the end of 2025, our Africa operations accounted for:

  • A gold Mineral Reserve of 22.6Moz, equivalent to 62% of our total gold Mineral Reserve (2024: 22.6Moz; 72%)
  • A gold Measured and Indicated Mineral Resource of 26.8Moz, equivalent to 40% of our total gold Measured and Indicated Mineral Resource (2024: 26.4Moz; 39%)
  • A gold Inferred Mineral Resource of 23.6Moz, equivalent to 48% of the Group total gold Inferred Mineral Resource (2024: 23.8Moz; 43%)

Our FAP programme continues to deliver across our Africa operations, contributing to operating predictably, driving cash flows and improving the long-term value of our business. We continuously monitor improvements in the fundamental drivers at each site such as mining volumes, recoveries and development rates, which, if enhanced, will boost production and should improve cash flows.

2025 at a glance

Gold produced(1,2)

(2024: 1.56Moz, 59%)

Total cash cost APM (1,3)

(2024: $1,157/oz)

People employed on average at
managed operations

(2024: 24,942; 15,951)

TRIFR

(2024: 0.49)

Invested in communities(1)

(2024: $14.34m)

Productivity(1)

(2024: 12.31)

Operating cash flow APM (1)

(2024: $1.57bn)

Capital expenditure(1)

(2024: $814m)

Scope 1 and 2 GHG emissions (CO2e)

(2024: 894kt)

  1. Includes Kibali
  2. 2025 production: Africa managed operations 1.746Moz and Kibali: 303,000oz (2024: Africa managed operations: 1.254Moz and Kibali: 309,000oz)
  3. 2025 total cash costsAPM: Africa managed operations: $1,182/oz and Kibali: $1,148/oz (2024: Africa managed operations: $1,212/oz and Kibali: $935/oz)
Gold production (000oz)
Productivity (oz/total employee costed)
TRIFR (injuries per million hours worked)
Cost performance ($/oz)

Performance by operation

Gold production rose 2% year-on-year to 492,000oz in 2025 (2024: 483,000oz). The lift in production was mainly driven by a 8% improvement in head grade to 3.26 g/t, reflecting increased tonnes and higher-grade ore from the Nyamulilima Cut 2 open cut mine.

The improved grade more than offset a 1% drop in metallurgical recovery and a 4% decrease in tonnes treated due to several periods of limited operation, for unplanned maintenance and during periods of post-election incidents.

The total cash costAPM increased by 5% to $1,038/oz ($984/oz in 2024), mainly due to higher direct operating costs, including higher contracting costs and additional expenditure on fleet and processing plant maintenance.

Geita’s transition to Tanzania’s national electricity grid, TANESCO, which is ~45% supplied by renewable energy sources, was stabilised during the year. By year end, grid availability was at 90%.

FAP projects during the year included the successful introduction of tele-remote bogging from surface during shift changes to improve mining productivity.

In the second half of 2025, the Company allocated an additional $15m a year for exploration at Geita over a three-year period, targeting growth in the Mineral Reserve to increase mine life from the current level of seven years to more than 10 years at gold production rates of approximately 500,000oz per year.

A conceptual study on expansion of the processing plant indicated gold production could be lifted to approximately 600,000oz a year for at least a decade while optimising mining rates in the underground mines and the open pit. A detailed feasibility study was initiated in Q4 2025 and is expected to be completed by 2027.

The proposed expansion has been underpinned by additions to the Mineral Reserve from the Nyamulilima open cut and Nyankanga underground mines, along with the availability of significant lower stockpiles generated by the site’s grade streaming strategy.

Geita’s net VAT receivable closing balance at 31 December 2025 was $171m (2024: $163m), up from the prior year mainly due to new claims submitted. The offsetting of verified VAT claims against corporate tax payments partially alleviated this, with $95m of verified VAT claims being offset against the corporate tax liability in 2025.

Gold production increased year-on-year to 289,000oz in 2025 (2024: 273,000oz) at a total cash costAPM of $1,783/oz (2024: $1,703/oz) despite a 43-day plant stoppage in the second half to address seepage on a section of the south wall of the TSF due to significant rainfall.

The 6% increase in production reflected a significant improvement in metallurgical recovery from 85% in 2024 to 91% in 2025 due to plant efficiency improvements including carbon management, oxygen injection and automated sampling.

The 5% increase in total cash cost per ounceAPM was mainly due to higher plant maintenance costs to complete maintenance during the 43-day plant shutdown and higher royalties, partially offset by higher gold production.

A strategic asset review delivered optimised pit sequencing and staging, which along with a focus on drill and blast activities, contributed to an increase in mining volumes, with mining largely taking place in the Siraya pit in Block 2 and the Kami and Kosise pits in Block 1.

The processing plant treated 10.8Mt in 2025, 3% down on 2024 throughput due to the processing stoppage from mid-August to the end of September.

Processing was halted to suspend deposition of tailings while seepage on a section of the south wall of the TSF was addressed following significant rainfall. A project to buttress the perimeter of the TSF was making good progress at year end. While remediation work was being carried out, tailings were deposited in the mined-out Silikoro pit.

AngloGold Ashanti’s FAP methodology was applied to collaborative work with the community on a long-term Social Economic Development Plan to strengthen the site’s social licence to operate.

Initiatives included literacy training, construction of a ring road, the roll out of AngloGold Ashanti’s successful malaria programme, mobile health care and scholarship programmes.

Gold production dropped by 16% to 199,000oz in 2025 from 237,000oz in 2024 due to an unplanned 17-day plant shutdown in Q1 2025, a reduction in recovered grades and power supply interruptions.

The plant was shut down and tailings deposition suspended while a tear in the lining of the Beposo TSF was investigated and repaired. Recovered grades were lower in 2025 following depletion of the higher-grade Cut 2B and Block 5 pits in 2024. This was partially offset by the contribution of higher-grade ore in the second half when the Block 7/8 Cut 1 pit came on stream.

Input from a strategic asset review addressed staging of the open pits and lifting mining volumes, which had improved and stabilised by year end.

The TSF-related plant shutdown and power interruptions reduced processing plant throughput for the year by 5% to 5.1Mt.

The 16% drop in gold production impacted the total cash costAPM which increased by 33% to $1,482/oz in 2025 compared with $1,118/oz in 2024. Costs were also impacted by increased expenditure on the Beposo TSF, higher mining contractor and maintenance costs and higher production taxes and royalties.

Gold production increased significantly to 266,000oz in 2025 (2024: 221,000oz) in line with the ramp up plan.

The hybrid mining approach, combining underhand drift and fill methods for higher grade areas in the mine with conventional sub-level open stoping, was successfully embedded, with higher underground ore tonnes mined in 2025 at higher milled grades due to lower dilution.

Stoping performance improved following an FAP project that introduced a second Epiroc Easer-L. This additional machine accelerated slot opening and increased the total number of active stopes.

Other FAP mining projects include construction of an underground workshop to reduce the need to tram equipment to surface, the introduction of tele-remote loading from surface during shift changes and new ventilation raises to open up new mining fronts for development. Commissioning of material handling infrastructure as part of the Kwesi Mensa Shaft refurbishment will be completed in the second half of the year.

Processing plant recoveries improved by 3% year-on-year to 89%, supported by the installation of a second flash cell and processing of higher-grade ore. Tonnes treated was slightly up and the average mill head grade was 13% higher in 2025 relative to the previous year.

The total cash costAPM increased by 9% to $1,325/oz (2024: $1,214/oz) due to increased contractor costs, elevated consultant and maintenance expenditure and higher labour costs.

In its first full year under AngloGold Ashanti ownership, Sukari produced 500,000oz at a total cash costAPM of $783/oz.

The operation exceeded plan with improved ore production from the underground mine and improved open pit volumes and grades. The processing plant treated 12.18Mt of ore at a head grade of 1.37g/t and a recovery of 89%, all in line with, or slightly better than, plan.

FAP initiatives at the site during the year focused on rationalising and upgrading the mining fleet, introducing larger truck trays underground, shortening open pit waste haulage and optimising grade control. Waste stripping in the open pit was prioritised in 2025 to set up mining areas in 2026.

The integration of Sukari has been successfully completed.

The total cash costAPM was positively impacted by the higher processed grade and higher gold production. Operational cost improvements included the impact of newly implemented contracting strategies and lower ammonium nitrate prices, both of which reduced direct mining costs. Further efficiencies were achieved through operational optimisation and productivity improvements.

Attributable production was 303,000oz at a total cash costAPM of $1,148/oz in 2025 compared to 309,000oz at a total cash costAPM of $935/oz in 2024. The 2% decrease in gold production reflected a 2% drop in tonnes treated and a lower head grade of 2.79g/t compared to 2.82 g/t in 2024.

Gold production was slightly lower year-on-year mainly due to a 2% decrease in tonnes treated due to a shutdown overrun and equipment availability issues, partly offset by higher open pit recovered grades.

Total cash costAPM per ounce increased by 23%, mainly due to higher operating costs resulting from higher consumable and mining costs, higher gold royalties resulting from the higher gold price and lower gold production.

Priorities 2026

  • At Obuasi the ramp up will continue, with an ongoing focus on building development capacity, completion of the underground workshop and additional tele-remote equipment to augment material handling capacity.
  • At Siguiri, development of the Block 3 mining area has been approved and permitting was nearing completion in the first half of 2026. Access road construction is underway. Remediation work on the TSF will continue, following the seepage event in the second half of 2025. In parallel, a feasibility study on a new tailings dam will be completed. Work to upgrade the gravity circuit in the processing plant is expected to begin late in the first half of 2026
  • At Geita, exploration targeting 60% growth in the Mineral Reserve will continue alongside a detailed feasibility study on a processing plant expansion to underpin a lift in production to ~600,000oz a year for at least a decade. The study is expected to be completed in 2027
  • At Sukari, design work was underway in early 2026 on stage seven of TSF 2. The site will also construct a third dump leach facility during the year
  • At Iduapriem, FAP work will focus on improving maintenance, increasing mining productivity and optimising the fleet management system

Disclaimer

This webpage does not purport to be a complete summary of the applicable underlying report and is qualified in its entirety by reference to the applicable underlying report. This webpage should be read in conjunction with the applicable underlying report, including the qualifications and limitations described therein, as there may be information in the applicable underlying report that may be important.

All Mineral Resource and Mineral Reserve information should be read in conjunction with Item 4D. Mineral Resource and Mineral Reserve in AngloGold Ashanti’s annual report on Form-20F for the fiscal year ended 31 December 2025, as filed with the U.S. Securities and Exchange Commission, as well as AngloGold Ashanti’s 2025 Mineral Resource and Mineral Reserve Report.

Forward-looking statements

Certain statements contained in this webpage, other than statements of historical fact, including, without limitation, those concerning the economic outlook for the gold mining industry, expectations regarding gold prices, production, mine life, total cash costs, all-in sustaining costs, cost savings and other operating results, return on equity, productivity improvements, growth prospects, preliminary financial and production metrics for in-process projects, the ability to convert Mineral Resource into Mineral Reserve and replace Mineral Reserves net of depletion from production and outlook of AngloGold Ashanti’s operations, individually or in the aggregate, including the achievement of project milestones, commencement and completion of commercial operations of certain of AngloGold Ashanti’s exploration and production projects and the completion of acquisitions, dispositions or joint venture transactions, AngloGold Ashanti’s liquidity and capital resources and capital expenditures and the outcome and consequences of any potential or pending litigation or regulatory proceedings or environmental, health and safety issues, are forward-looking statements regarding AngloGold Ashanti’s financial reports, operations, economic performance and financial condition.

These forward-looking statements or forecasts are not based on historical facts, but rather reflect our current beliefs and expectations concerning future events and generally may be identified by the use of forward-looking words, phrases and expressions such as “believe”, “expect”, “aim”, “anticipate”, “intend”, “foresee”, “forecast”, “predict”, “project”, “estimate”, “likely”, “may”, “might”, “could”, “should”, “would”, “seek”, “plan”, “scheduled”, “possible”, “continue”, “potential”, “outlook”, “target” or other similar words, phrases, and expressions; provided that the absence thereof does not mean that a statement is not forward-looking. Similarly, statements that describe our objectives, plans or goals are or may be forward-looking statements.

These forward-looking statements or forecasts involve known and unknown risks, uncertainties and other factors that may cause AngloGold Ashanti’s actual results, performance, actions or achievements to differ materially from the anticipated results, performance, actions or achievements expressed or implied in these forward-looking statements. Although AngloGold Ashanti believes that the expectations reflected in such forward-looking statements and forecasts are reasonable, no assurance can be given that such expectations will prove to have been correct. Accordingly, results, performance, actions or achievements could differ materially from those set out in the forward-looking statements as a result of, among other factors, changes in economic, social, political and market conditions, including related to inflation or international conflicts, the success of business and operating initiatives, changes in the regulatory environment and other government actions, including environmental approvals, fluctuations in gold prices and exchange rates, the outcome of pending or future litigation proceedings, any supply chain disruptions, any public health crises, pandemics or epidemics, the failure to maintain effective internal control over financial reporting or effective disclosure controls and procedures, the inability to remediate one or more material weaknesses, or the discovery of additional material weaknesses, in the Company’s internal control over financial reporting, and other business and operational risks and challenges and other factors, including mining accidents. For a discussion of such risk factors, refer to the Company’s annual report on Form 20-F for the financial year ended 31 December 2025, filed with the U.S. Securities Exchange Commission. These factors are not necessarily all of the important factors that could cause AngloGold Ashanti’s actual results, performance, actions or achievements to differ materially from those expressed in any forward-looking statements. Other unknown or unpredictable factors could also have material adverse effects on AngloGold Ashanti’s future results, performance, actions or achievements. Consequently, readers are cautioned not to place undue reliance on forward-looking statements.

AngloGold Ashanti undertakes no obligation to update publicly or release any revisions to these forward-looking statements to reflect events or circumstances after the date of publication or to reflect the occurrence of unanticipated events, except to the extent required by applicable law. All subsequent written or oral forward-looking statements attributable to AngloGold Ashanti or any person acting on its behalf are qualified by the cautionary statements herein.

NON-GAAP financial measures

This document may contain certain “Non-GAAP” financial measures, including, without limitation, “total cash costs”, “total cash costs per ounce”, “all-in sustaining costs”, “all-in sustaining costs per ounce”, “average gold price received per ounce”, “sustaining capital expenditure”, “non-sustaining capital expenditure”, “Adjusted EBITDA”, “Adjusted net debt (cash)”, “operating cash flow” and “free cash flow”. AngloGold Ashanti utilises certain Non-GAAP performance measures and ratios in managing its business. Non-GAAP financial measures should be viewed in addition to, and not as an alternative for, the reported operating results or cash flow from operations or any other measures of performance prepared in accordance with IFRS. In addition, the presentation of these measures may not be comparable to similarly titled measures other companies may use. Reconciliations from IFRS to the Non-GAAP financial measures used in this document can be found either in this document, or in AngloGold Ashanti’s Earnings Release for the three months and the year ended 31 December 2025, which is available on AngloGold Ashanti’s website, or in its annual report on Form 20-F for the financial year ended 31 December 2025 as filed with 
the SEC.

2025 Mineral Resource and Mineral Reserve information

The Mineral Resource and Mineral Reserve stated herein were prepared in compliance with Subpart 1300 of Regulation S-K (17 CFR § 229.1300) (“Regulation S-K 1300”). Refer to Item 1300 (Definitions) of Regulation S-K for the meaning of the terms used in AngloGold Ashanti’s Mineral Resource and Mineral Reserve reporting. The Mineral Resource and Mineral Reserve represent the amount of gold, copper, silver, sulphur and molybdenum estimated at 31 December 2025 and are based on information available at the time of estimation. Such estimates are, or will be, to a large extent, based on the prices of the respective commodities and interpretations of geologic data obtained from drill holes and other exploration techniques, which data may not necessarily be indicative of future results. The Mineral Resource and Mineral Reserve estimates are published at 31 December 2025, taking into account economic assumptions, changes to future production and capital costs, depletion, additions as well as any acquisitions or disposals during 2025. The legal tenure of each material property has been verified to the satisfaction of the accountable Qualified Person and all of the Mineral Reserve has been confirmed to be covered by the required mining permits or there exists a realistic expectation, based on applicable laws and regulations, that issuance of permits or resolution of legal issues necessary for mining and processing at a particular deposit will be accomplished in the ordinary course and in a timeframe consistent with AngloGold Ashanti’s (or its joint venture partners’) current mine plans. For the Mineral Reserve, the term “economically viable” means that profitable extraction or production has been established or analytically demonstrated in, at a minimum, a pre-feasibility study, to be economically viable under reasonable investment and market assumptions. Mineral Reserve is subdivided and reported, in order of increasing geoscientific knowledge and confidence, into Probable and Proven Mineral Reserve categories. Mineral Reserve is aggregated from the Probable and Proven Mineral Reserve categories. Ounces of gold or silver or pounds of copper or sulphur included in the Probable and Proven Mineral Reserve are estimated and reported as delivered to plant (i.e., the point where material is delivered to the processing facility) and exclude losses during metallurgical treatment. In compliance with Regulation S-K 1300, the Mineral Resource herein is reported as exclusive of the Mineral Reserve before dilution and other factors are applied, unless otherwise stated. Mineral Resource is subdivided and reported, in order of increasing geoscientific knowledge and confidence, into Inferred, Indicated and Measured Mineral Resource categories. Ounces of gold or silver or pounds of copper, sulphur or molybdenum included in the Inferred, Indicated and Measured Mineral Resource are those contained in situ prior to losses during extraction and processing. While it would be reasonable to expect that the majority of Inferred Mineral Resource would upgrade to Indicated Mineral Resource with continued exploration, due to the uncertainty of Inferred Mineral Resource, it should not be assumed that such upgrading will always occur.

If estimations must be revised due to significantly lower commodity prices, increases in operating costs, reductions in metallurgical recovery or other factors, the Mineral Resource or Mineral Reserve may not be mined or processed profitably. In addition, material write-downs of AngloGold Ashanti’s investment in its mining properties may be required, including impacts on goodwill, as well as increased amortisation, reclamation and closure charges. If AngloGold Ashanti determines that certain parts of its Mineral Resource or Mineral Reserve have become uneconomic, this may ultimately lead to a reduction in its reported aggregate Mineral Resource or Mineral Reserve, respectively. Consequently, if AngloGold Ashanti’s actual Mineral Resource and Mineral Reserve is less than current estimates, its business, prospects, results of operations and financial position may be materially impaired.

Pre-feasibility and feasibility studies for undeveloped ore bodies present estimated capital expenditure and operating costs based on anticipated tonnage and grades of ore to be mined and processed. Other factors underlying the estimations include, among others, the predicted configuration of the ore body, anticipated metal recovery rates, and estimated costs of operating and processing equipment and facilities. Actual operating and capital expenditure cost and economic returns on projects may differ significantly from original estimates. Further, it may take many years from the initial phases of exploration until commencement of production, during which time, the economic feasibility of production may change. The Mineral Resource is subject to further exploration and development, and is subject to additional risks, and no assurance can be given that they will eventually convert to Mineral Reserve.

For additional information, refer to Table 1 (Summary Mineral Resource) and Table 2 (Summary Mineral Reserve) to Paragraph (b) of Item 1303 (Summary disclosure) of Regulation S-K, which are in AngloGold Ashanti’s annual report on Form 20-F for the financial year ended 
31 December 2025 filed with the SEC. These summary tables include each class of Mineral Resource (Inferred, Indicated and Measured) together with total Measured and Indicated Mineral Resource, and each class of Mineral Reserve (Probable and Proven) together with total Mineral Reserve. The Mineral Resource at the end of the financial year ended 31 December 2025 was estimated using a gold price of $2,000/oz (2024: $1,900/oz), a copper price of $3.50/lb (2024: $3.50/lb), a silver price of $23.00/oz (2024: $23.00/oz) and a molybdenum price of $12.00/lb (2024: $12.00/lb), unless otherwise stated. The Mineral Reserve at the end of the financial year ended 31 December 2025 was estimated using a gold price of $1,700/oz (2024: $1,600/oz), a copper price of $3.10/lb (2024: $2.90/lb) and a silver price of $19.50/oz 
(2024: $19.50/oz), unless otherwise stated. The net difference between the Mineral Resource and Mineral Reserve at the end of the last completed financial year and the preceding financial year will be detailed for material properties, if applicable, in AngloGold Ashanti’s annual report on Form 20-F for the financial year ended 31 December 2025.

The Mineral Resource exclusive of Mineral Reserve is defined as the inclusive Mineral Resource less the Mineral Reserve before dilution and other factors are applied.